mirror of
https://github.com/facebook/react-native.git
synced 2025-11-01 09:14:26 +00:00
Summary: When experimenting with React Profiler API (https://reactjs.org/docs/profiler.html), I noticed that durations are integers without a debugger, but they are doubles with higher precision when debugger is attached. After digging into React Profiler code, I found out that it's using `performance.now()` to accumulate execution times of individual units of work. Since this method does not exist in React Native, it falls back to Javascript `Date`, leading to imprecise results. This PR introduces `global.nativePerformanceNow` function which returns precise native time, and a very basic `performance` polyfill with `now` function. This will greatly improve React Profiler API results, which is essential for profiling and benchmark tools. Solves https://github.com/facebook/react-native/issues/27274 ## Changelog [General] [Added] - Implement `nativePerformanceNow` and `performance.now()` Pull Request resolved: https://github.com/facebook/react-native/pull/27885 Test Plan: ``` const initialTime = global.performance.now(); setTimeout(() => { const newTime = global.performance.now(); console.warn('duration', newTime - initialTime); }, 1000); ``` ### Android + Hermes 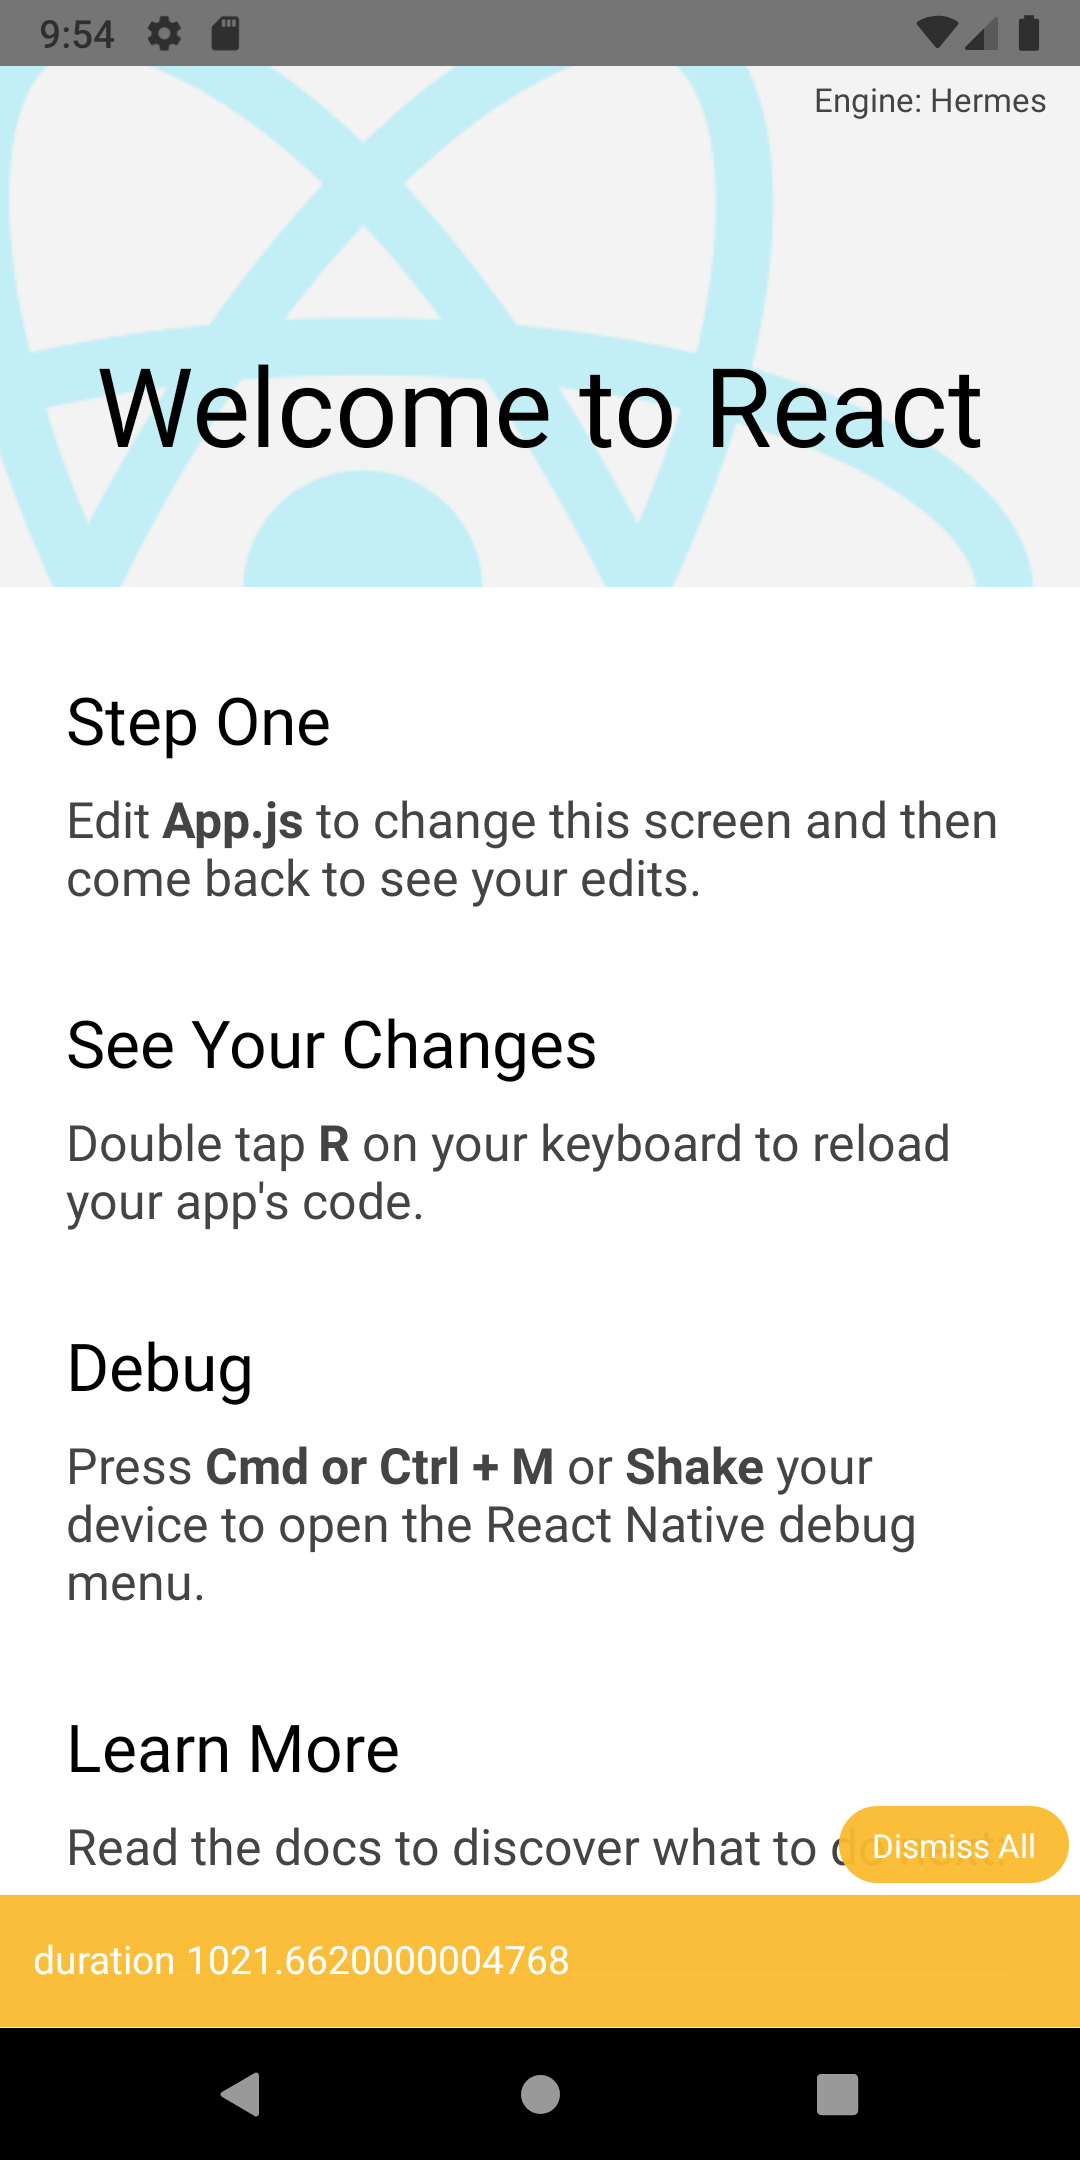 ### Android + JSC 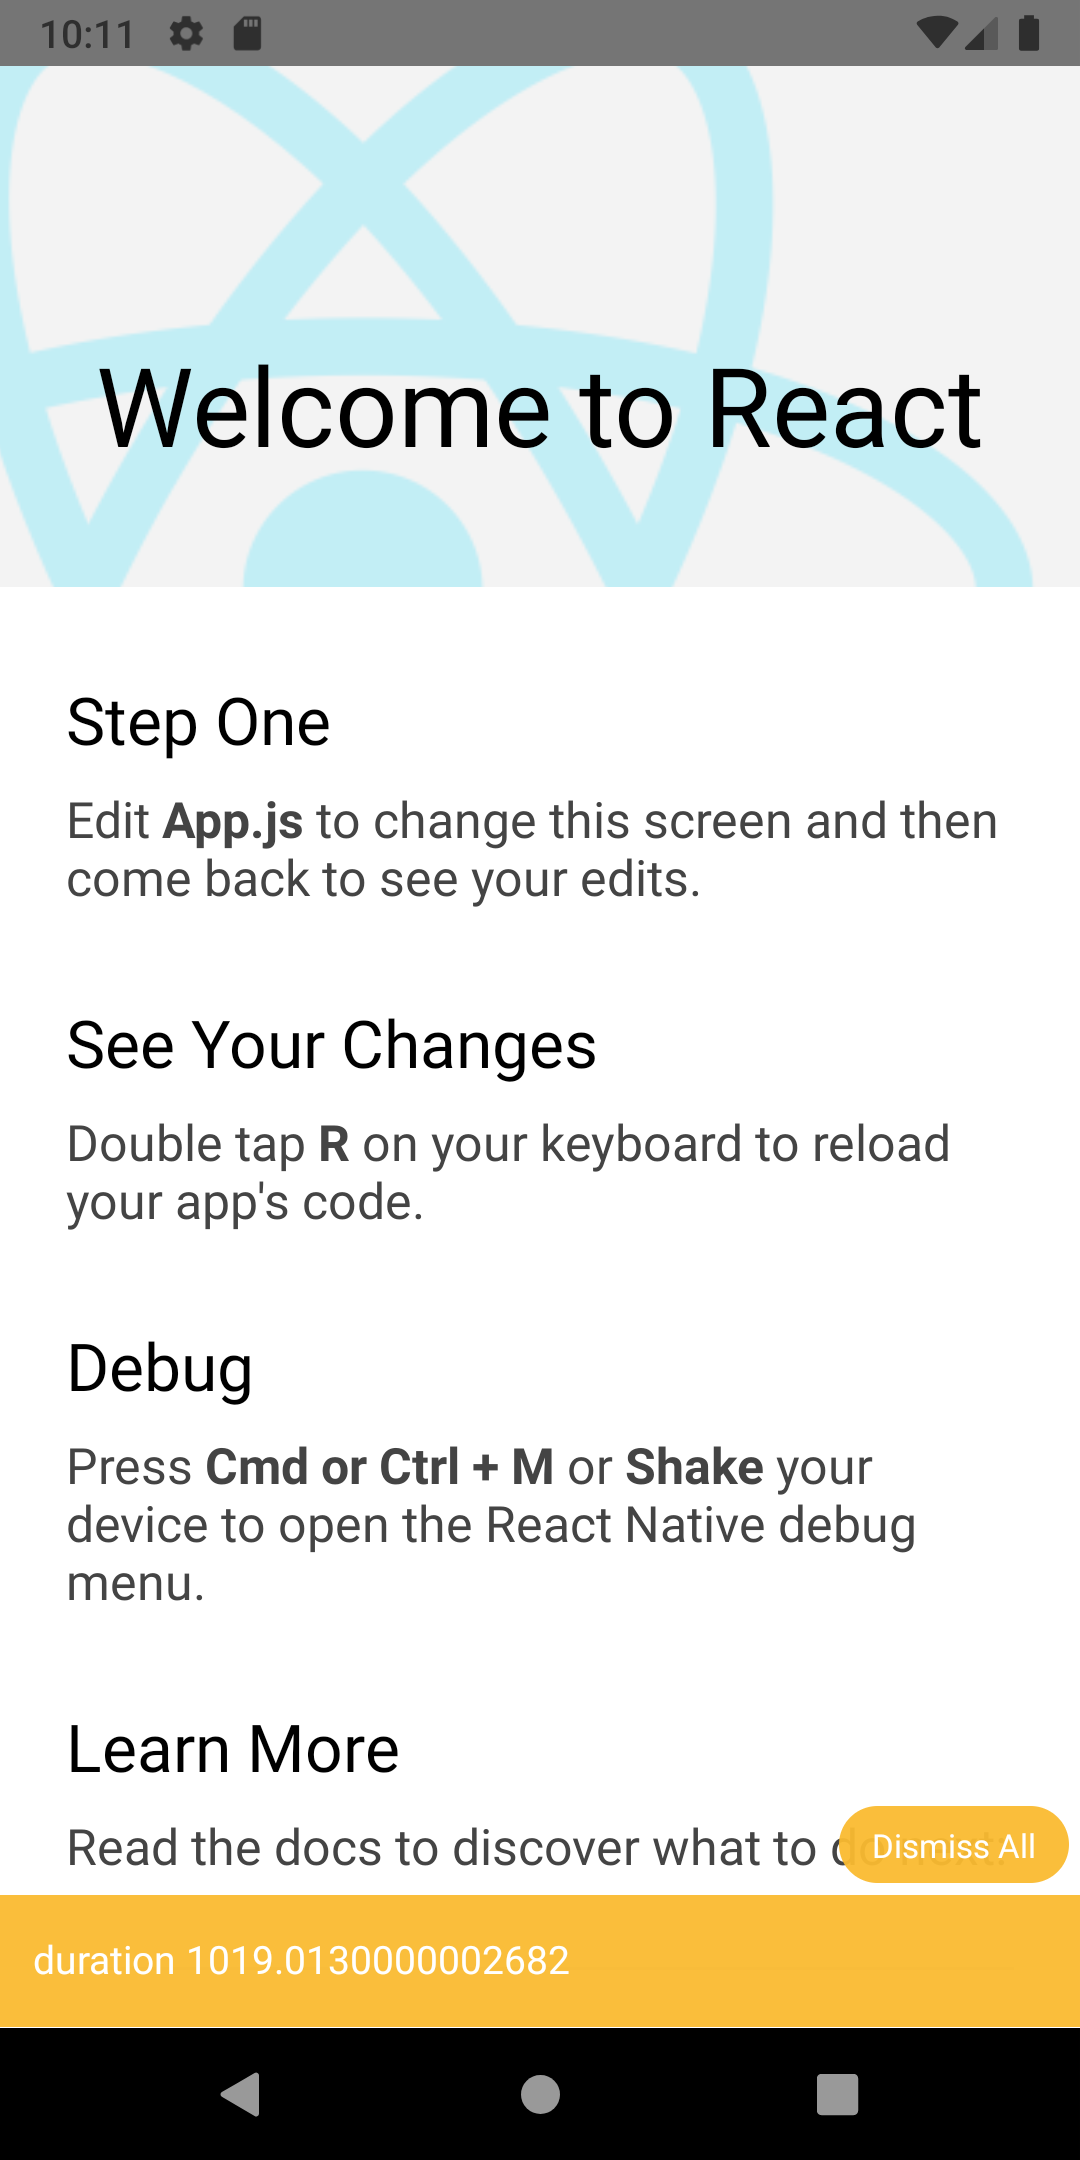 ### iOS 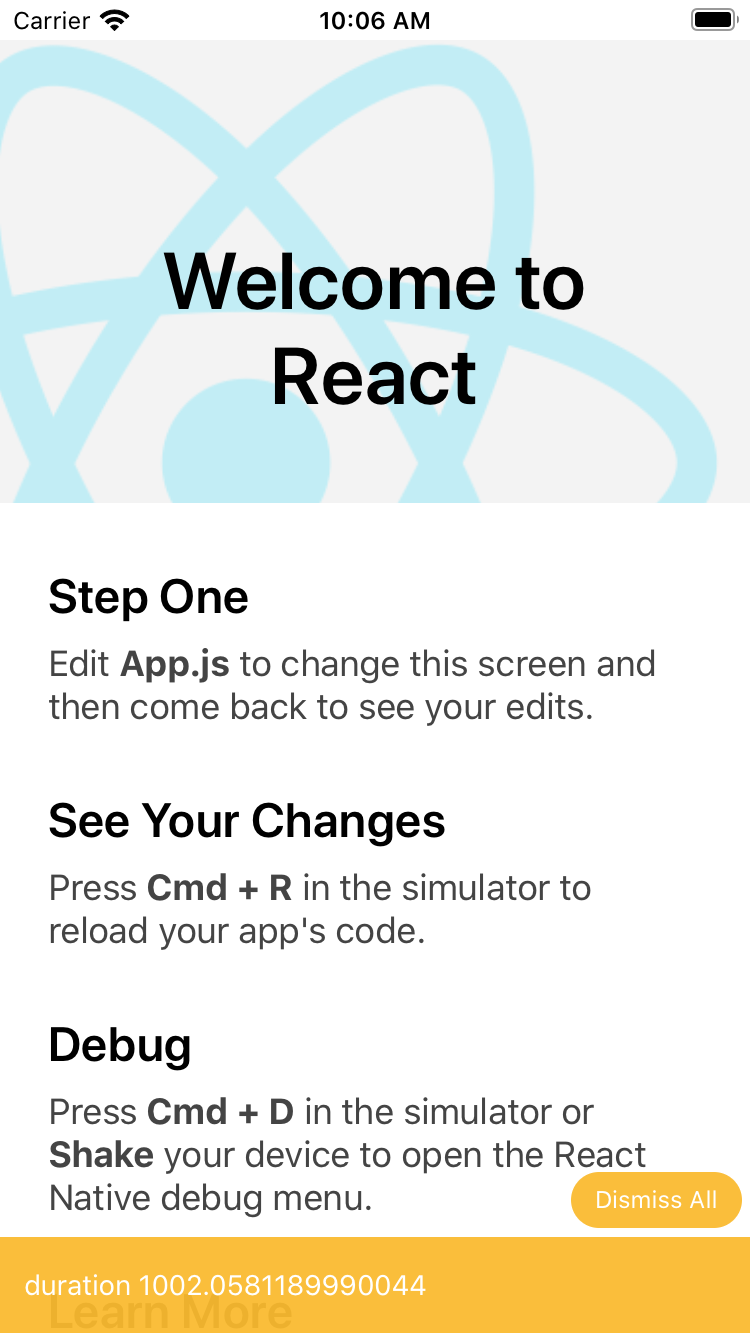 Reviewed By: ejanzer Differential Revision: D19888289 Pulled By: rickhanlonii fbshipit-source-id: ab8152382da9aee9b4b3c76f096e45d40f55da6c
57 lines
1.5 KiB
JavaScript
57 lines
1.5 KiB
JavaScript
/**
|
|
* Copyright (c) Facebook, Inc. and its affiliates.
|
|
*
|
|
* This source code is licensed under the MIT license found in the
|
|
* LICENSE file in the root directory of this source tree.
|
|
*
|
|
* @format
|
|
* @flow strict-local
|
|
*/
|
|
|
|
/* globals window: true */
|
|
|
|
/**
|
|
* Sets up global variables typical in most JavaScript environments.
|
|
*
|
|
* 1. Global timers (via `setTimeout` etc).
|
|
* 2. Global console object.
|
|
* 3. Hooks for printing stack traces with source maps.
|
|
*
|
|
* Leaves enough room in the environment for implementing your own:
|
|
*
|
|
* 1. Require system.
|
|
* 2. Bridged modules.
|
|
*
|
|
*/
|
|
|
|
'use strict';
|
|
|
|
const start = Date.now();
|
|
|
|
require('./setUpGlobals');
|
|
require('./setUpPerformance');
|
|
require('./setUpSystrace');
|
|
require('./setUpErrorHandling');
|
|
require('./polyfillPromise');
|
|
require('./setUpRegeneratorRuntime');
|
|
require('./setUpTimers');
|
|
require('./setUpXHR');
|
|
require('./setUpAlert');
|
|
require('./setUpNavigator');
|
|
require('./setUpBatchedBridge');
|
|
require('./setUpSegmentFetcher');
|
|
if (__DEV__) {
|
|
require('./checkNativeVersion');
|
|
require('./setUpDeveloperTools');
|
|
}
|
|
|
|
const GlobalPerformanceLogger = require('../Utilities/GlobalPerformanceLogger');
|
|
// We could just call GlobalPerformanceLogger.markPoint at the top of the file,
|
|
// but then we'd be excluding the time it took to require the logger.
|
|
// Instead, we just use Date.now and backdate the timestamp.
|
|
GlobalPerformanceLogger.markPoint(
|
|
'initializeCore_start',
|
|
GlobalPerformanceLogger.currentTimestamp() - (Date.now() - start),
|
|
);
|
|
GlobalPerformanceLogger.markPoint('initializeCore_end');
|